masih draf, asal posti saja
akan diperbaiki insyAllah
fleksibel lihat sikon yg ada
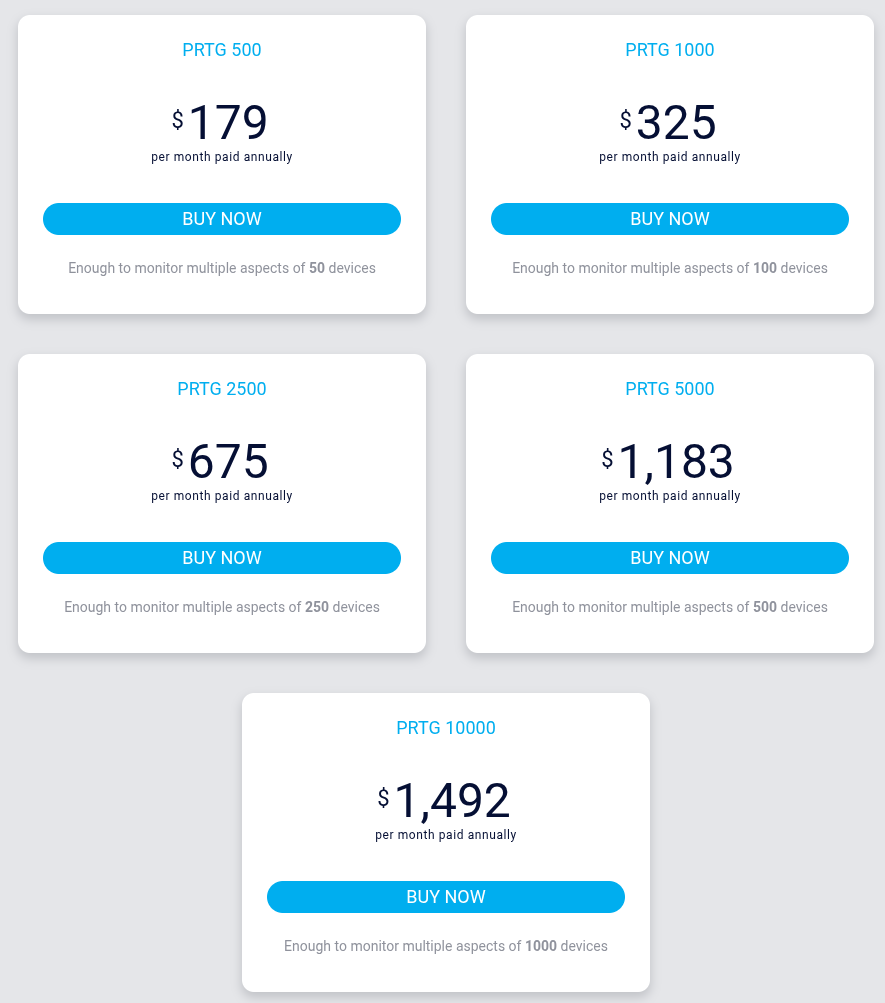
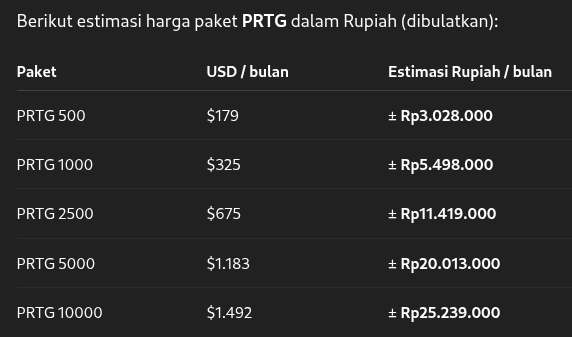
PRTG
- free (100 sensor) per PC/VPS
- OS : Windows, Linux
Cacti
- Free
- dulu pernah coba (pendapat pribadi) :
- tapi rumit saat konfig2 ini itu ini itu
- tampilan resolusi waktu kurang detail
Prometheus + Grafana
- Free
Zabbix
- Free
- sempat :
- populer direkomendasikan oleh orang2
LibreNMS
- open-source dan bebas biaya untuk digunakan, diunduh, dan dikembangkan
- link : https://docs.librenms.org/

- How to Create a Custom Dashboard on LibreNMS Server (Step-by-Step Guide) Bangla
https://www.youtube.com/watch?v=zbE-pewQ5vg - LibreNMS Installation on Linux | Monitor Servers & Network FREE (2025)
Instal manual LibreNMS + Konfig SNMP Router Mikrotik + Konfig SNMP windows server
https://youtu.be/OEV7PiF1opM?si=wGsYH273Tlp1G1Vq
Uptime Kuma
- Lisensi = Open Source
- Release awal = Juli 2021
- Multi platform = windows, linux
- link https://uptime.kuma.pet/
- Monitor HTTP/HTTPS domains, and keywords on webpages, monitor your DNS records, Docker Containers and even databases such as MySQL and SQL. —>> keliharannya kurang cocok untuk monitoring perangkat jaringan berbasis SNMP
- Protocol Monitoring yg di suppot Uptime Kuma
Observium
- Ada versi Free (Community Edition)
- https://www.observium.org
Dude (MikroTik)
- cocok untuk perangkat yg berbasis mikrotik OS
- mudah deploy, mudah konfig’nya, user friendly & user interface mudah dipahami
- responsive tampilannya (enak buat realtime monitoring) , tidak cocok untuk monitoring berbasis MRTG
Nagios
- protocol monitoring : SNMP, HTTP, SMTP, POP3, HTTP, PING,
- Peringatan / alert :
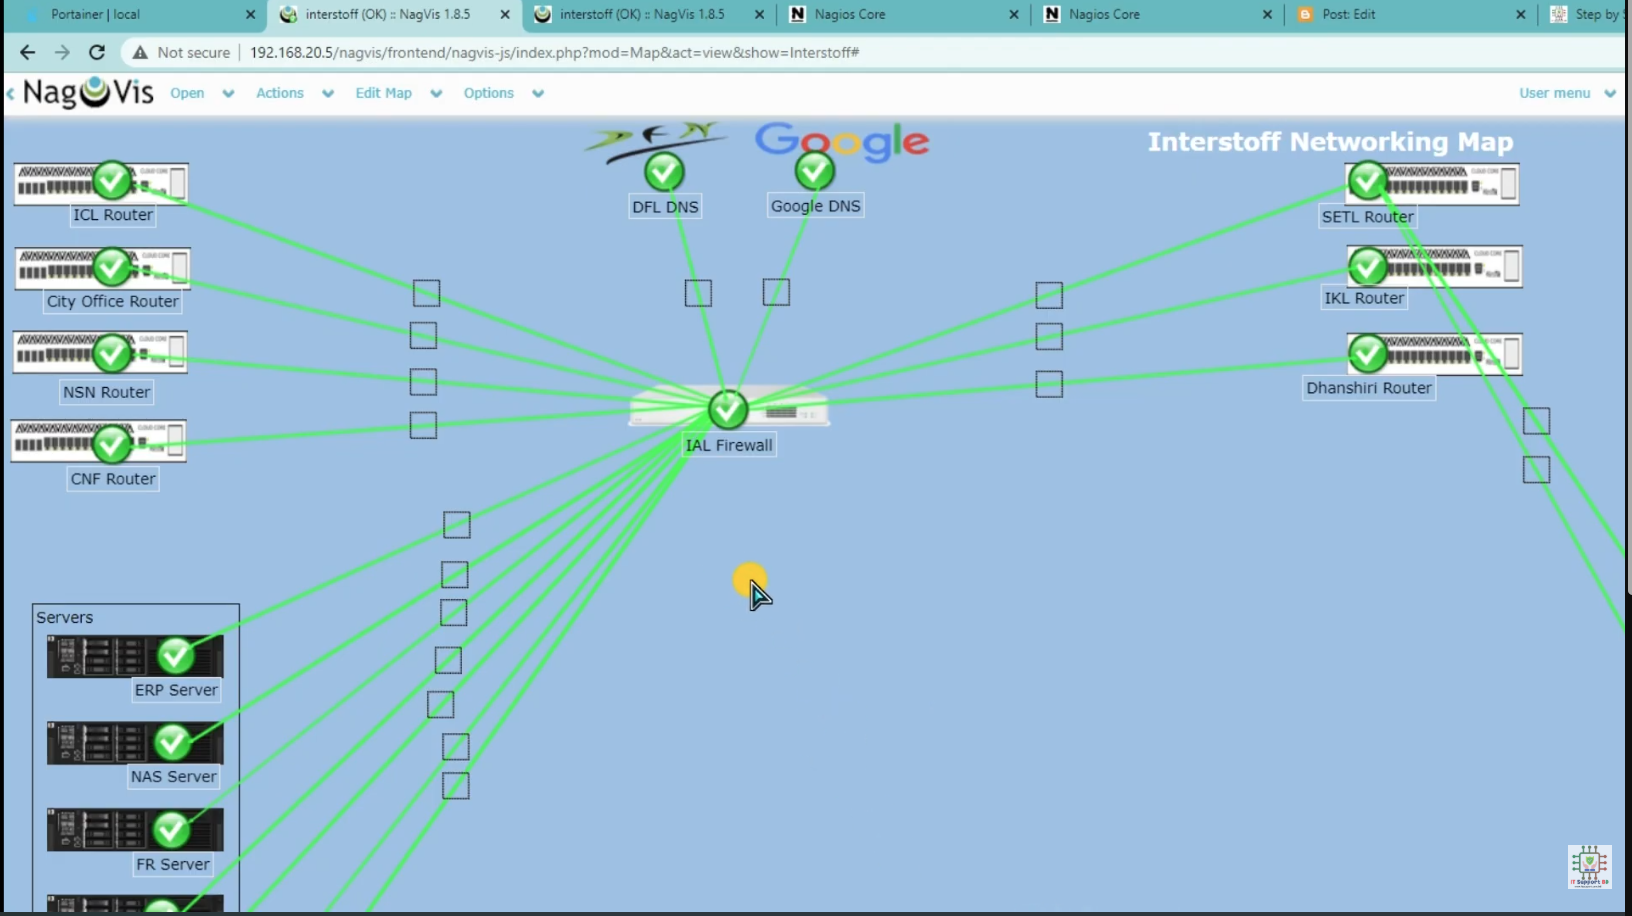
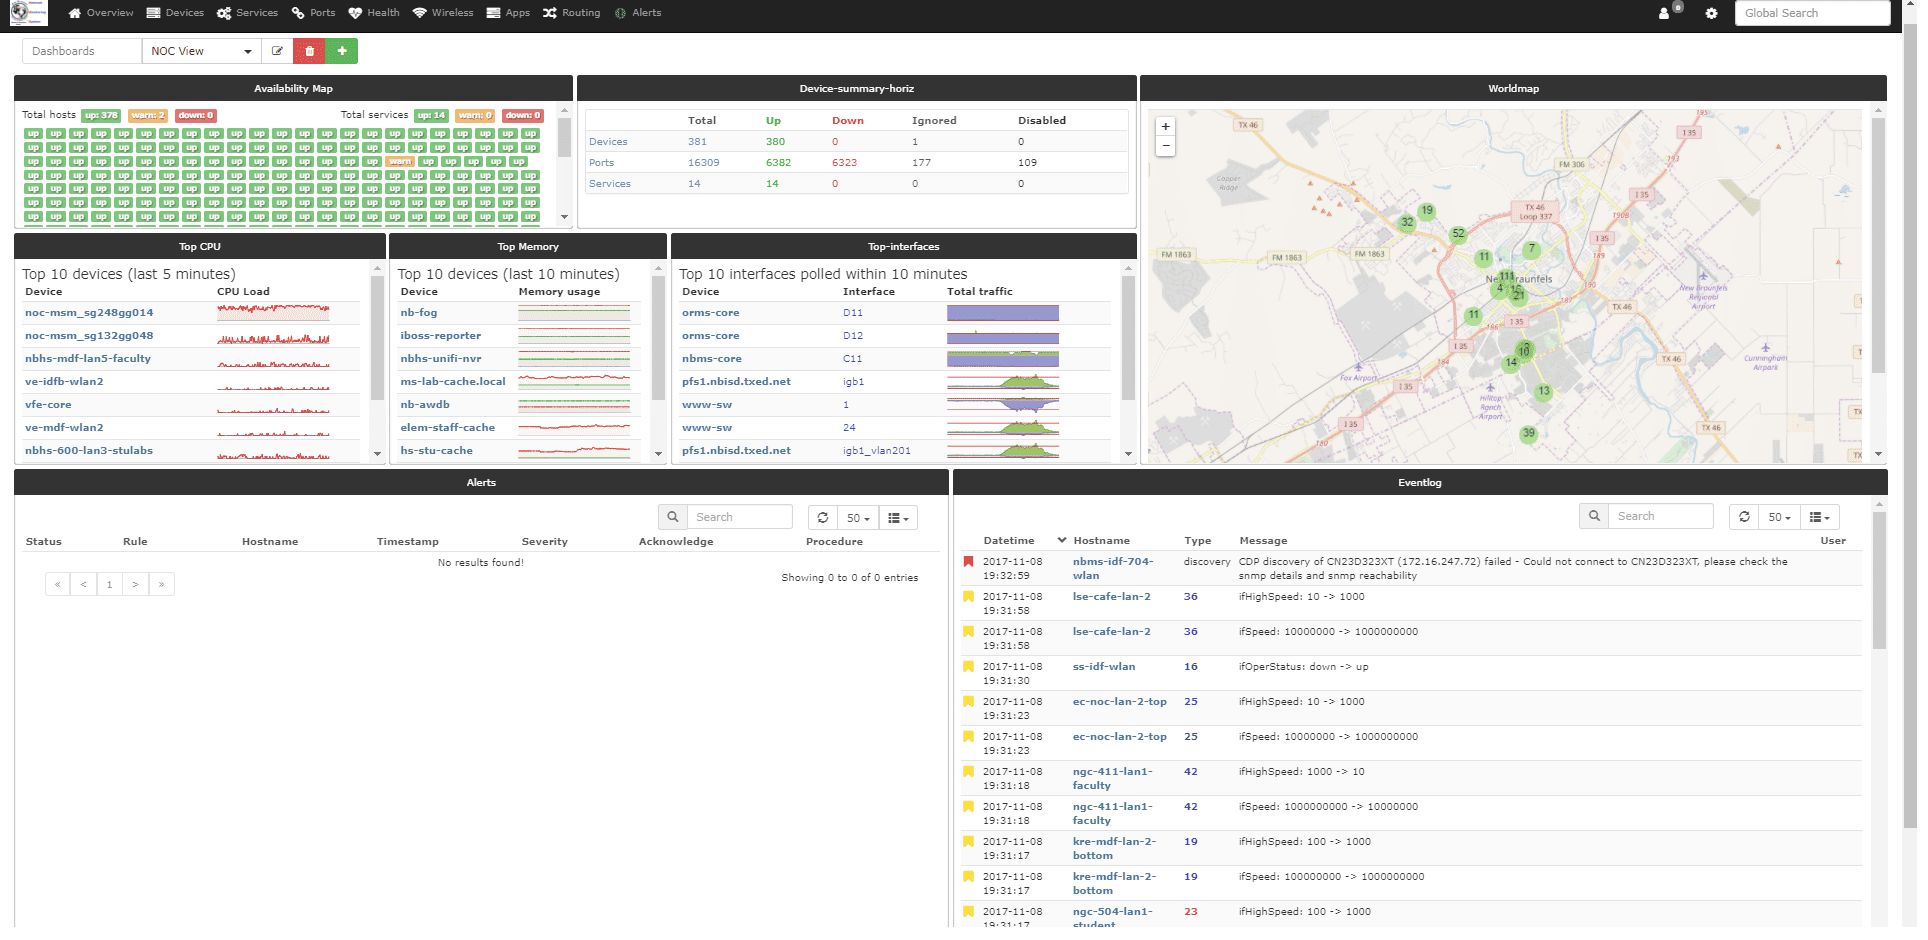
- Dashboard :
- Map :
- OS : Linux-based OS (Ubuntu, CentOS, Debian, RHEL, or compatible)
- Hardware :
- CPU: 2 cores minimum (4+ recommended for larger deployments)
- RAM: 2GB minimum (4GB+ recommended)
- Disk: 20GB free space minimum
- Network: Reliable network connectivity
- Open source : https://www.nagios.org/
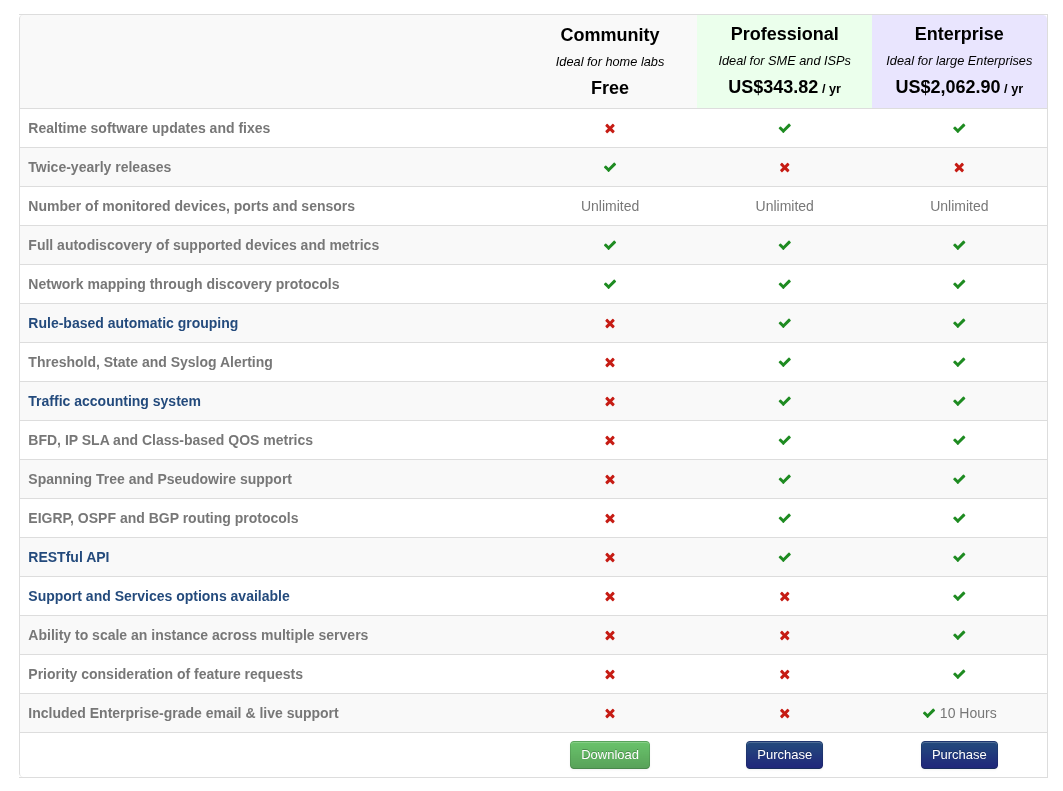
- versi berbayar (enterprise) : https://www.nagios.com/
- Awal release :
- 1996–1998 → Proyek awal dibuat oleh Ethan Galstad dengan nama NetSaint
- 1999 → Dirilis ke publik sebagai open source (NetSaint)
- 2002 → Nama diganti menjadi Nagios karena masalah trademark
- Setelah itu → berkembang pesat jadi salah satu tools monitoring jaringan/server paling populer
- link :
https://github.com/NagiosEnterprises/nagioscore
SolarWind
- berbayar
- dulu pernah nyoba [kesan awal/sekilas dulu make] : rumit untuk instalasi, konfigurasi & untuk menambahkan node/router + interface’nya kurang user friendly. dulu coba di OS Windows (lisensi 1 tahun)
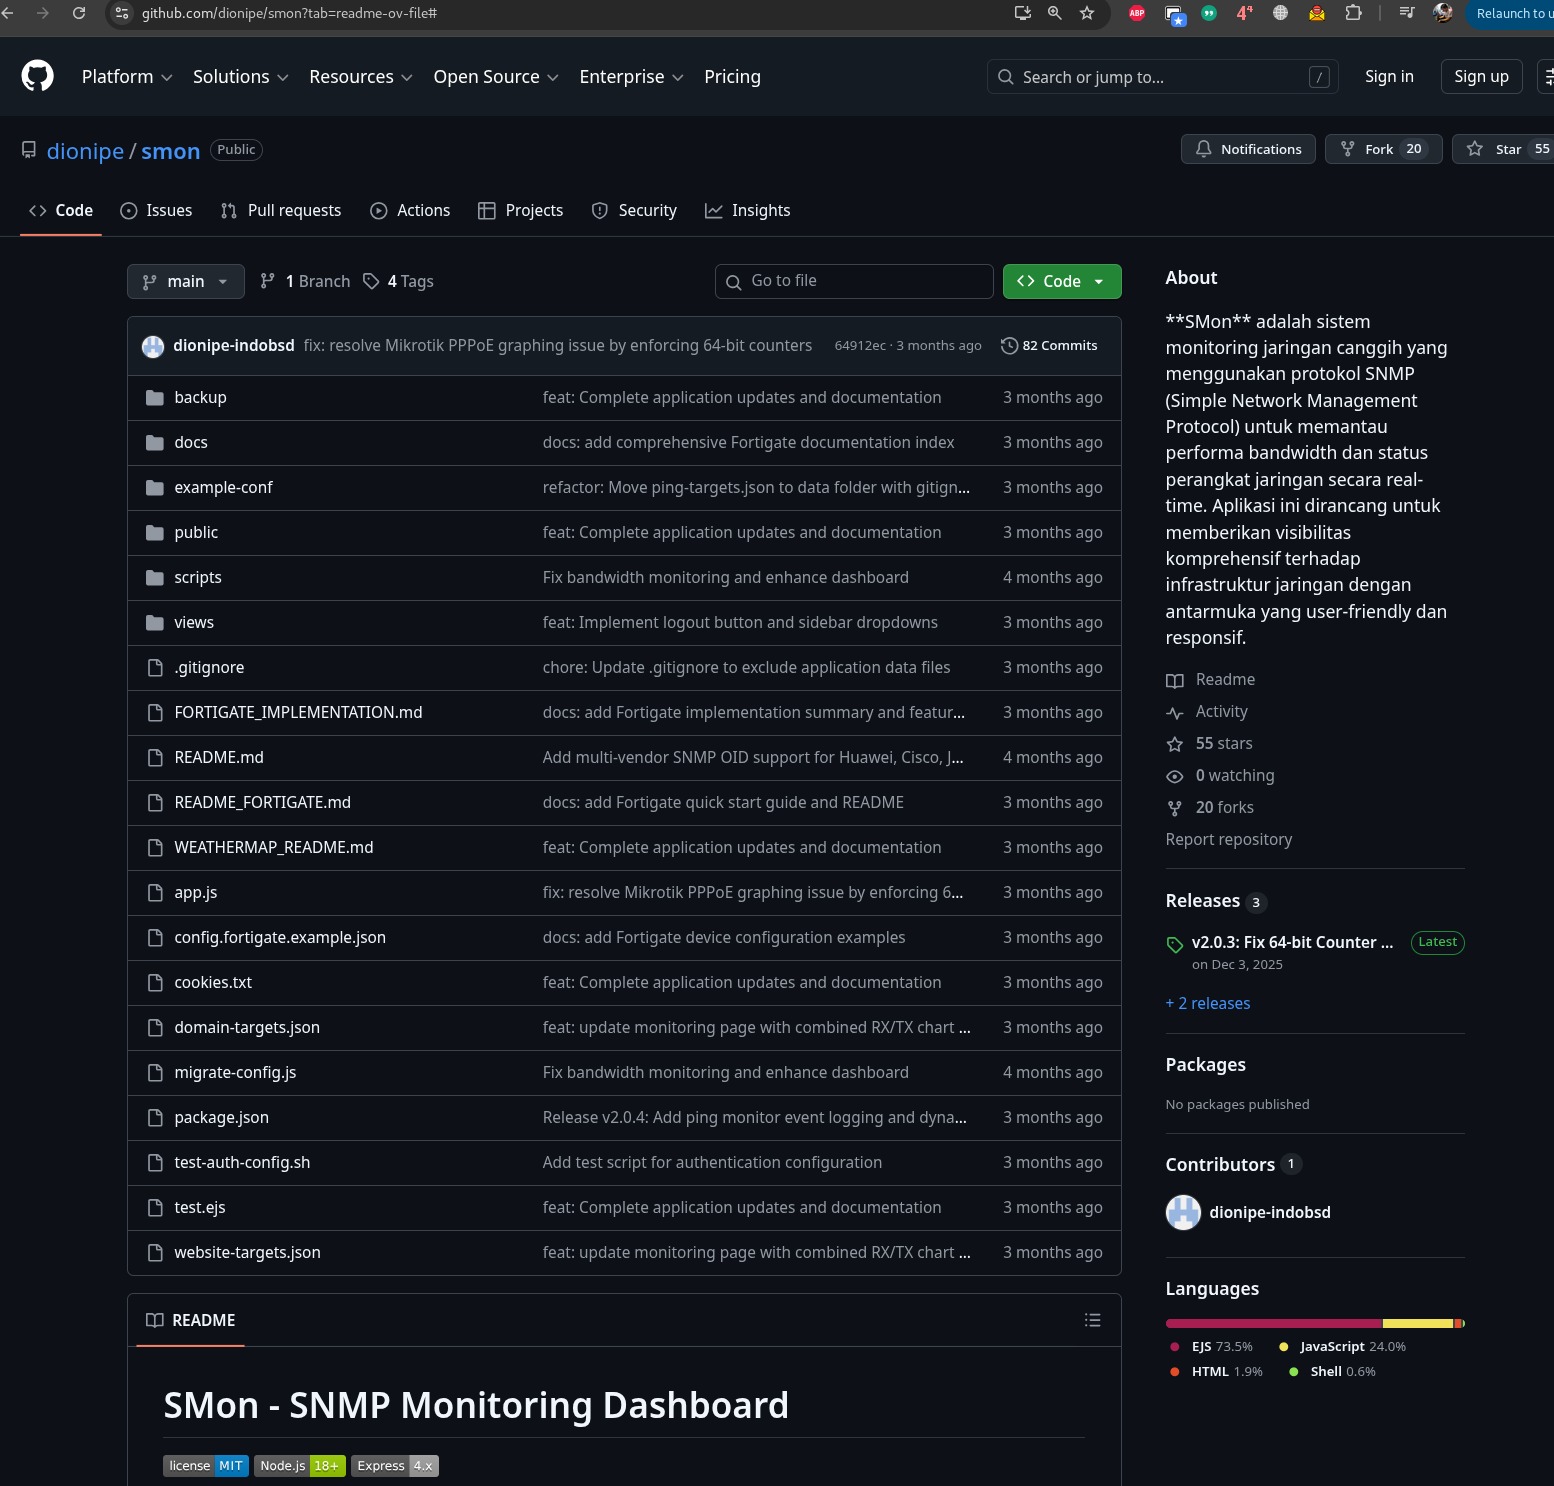
SMon
- link : https://github.com/dionipe/smon?tab=readme-ov-file#
- lisnesi : free
- Protocol monitoring = SNMP, ping,
- Release versi 1 = ..???
- versi 2.0 = Nov 2025
- tampilan dashboard’ny : cantik, menarik
- umur SMon sebagai tool monitoring masih muda …
- Maret 2026, udah coba konfig tapi masih belum berhasil deploy. hhhh
